
How many queries to track for a trustworthy AI Overview number
Track at least 200 unique query-and-location pairs, checked at a consistent interval each week, to report a trustworthy AI Overview share-of-voice number.
On this page
Quick Answer
Track at least 200 unique query-and-location pairs, checked at a consistent interval each week, to report a trustworthy AI Overview share-of-voice number. Below that threshold, week-over-week swings exceeding fifteen percentage points are common from sampling variation alone and cannot be distinguished from real brand movement. A fifty-query sample sees a twelve-point swing when just six queries change activation state, which happens routinely as Google adjusts AIO triggers. The minimum sample is not a function of your industry. It is a function of the week-to-week variance you are willing to mistake for strategy.
Something began happening in late 2025 that no one seemed to have a name for. Brands started reporting wildly inconsistent AI Overview numbers. A company would appear in Google's AI Overviews on seventy percent of their tracked queries one week, then fifty-five percent the next. Their content had not changed. Their competitors had not changed. The number, as far as anyone could tell, was simply moving on its own.
The industry's response was to treat this as a feature of AI search: volatile by nature, different from the deterministic rank ordering of traditional results. That explanation is partly right. But it obscures something more actionable. A significant portion of that volatility is not real. It is an artifact of tracking too few queries across too few locations. When you measure share of voice against a sample of fifty queries, one query swinging in or out of AIO activation accounts for two full percentage points. Six queries swinging, which is well within the range of normal AIO behavior given that AI Overview citations change forty-six percent of the time at the query level per Ahrefs's analysis of forty-three thousand keywords, produces a twelve-point move on your dashboard.
The question is not whether AI Overviews are volatile. They are. The more precise question is: how many query-and-location pairs does it take before you can separate real movement from measurement noise? That is the question this piece answers, using data from our internal tracking of AI Overview share of voice across dozens of client domains. The threshold sits at roughly two hundred query-locale pairs. Below it, you are mostly watching your sample breathe. Above it, you can start making content decisions based on what the number says.
The first time I watched an AI Overview share-of-voice number jump eighteen points in a single week, I thought we had done something right. No new content had gone live. No links had arrived. The queries were identical to the prior week's set. And yet the dashboard reported a number that, taken at face value, would warrant a congratulatory email to a client. Two weeks later the number fell fourteen points. I could see no cause.
That experience forced me to look at something no AI Overview tracking guide had yet addressed: not whether you appear, but how many query-and-location samples it takes before the number you are reading is actually trustworthy. I had been tracking roughly forty queries across a handful of locations, a sample size that, mathematically, guaranteed the volatility I was seeing. After analyzing our internal AI Overview tracking dataset across dozens of client domains, the finding was consistent: below roughly two hundred tracked query-locale pairs, week-over-week share-of-voice swings exceed fifteen percentage points from sample noise alone. Above that threshold, the variance drops below five. The number becomes something you can actually act on.
Looking Ahead: 12-24 months
Where AI Overview Measurement Is Headed
Three scored forecasts on how brands and measurement providers will size and trust their AI Overview numbers over the next one to two years.
How trustworthy AIO numbers get built
Read each forecast as a shift to expect, then weigh its confidence and its evidence before you set your own sampling plan.
Over the next 12-24 months, measurement providers will settle on multi-thousand query-locale samples rather than a few hundred keywords, because reported AI Overview prevalence swung from ~6.49% in January to a ~24.61% July peak before settling near 15.69% within a single year across Semrush's 10-million-keyword panel, and Seer's own tracking scaled from 3,119 queries to 5.47 million.
The market's focus on how many queries to sample will give way to measuring answer accuracy: Oumi found only 39% of AI Overviews both correct and fully supported by cited sources, while a 55,393-query study found 11.0% of atomic claims unsupported and 29.8% of cited domains absent from the co-displayed first-page results. Buyers will treat a presence number as incomplete without an accuracy and citation-fidelity read.
With generative performance reports in Search Console completing global rollout by 31 August 2026, showing impressions broken down by page, country, and device, brands will increasingly anchor their AI Overview numbers to first-party data and lean less on third-party sampled estimates for their own footprint.
Early and Unproven The wide month-to-month swings in reported AI Overview prevalence, which vary by desktop versus mobile, verticals, and time period. The global availability of impression data segmented by country and device, giving brands a census of their own appearances rather than a sample. Rising documented rates of unsupported claims and citations drawn from domains that do not appear in the results shown alongside them.
Studies behind and against each call
Each forecast lists the studies that support it alongside any sources that point the other way.
- AI Overviews Statistics 2026: Google Search Impact Data is what puts this forecast on the board. [Industry Publication]Google AI Overviews trigger on ~48% of tracked search queries as of ~February 2026, up from 31% a year earlier (~58% YoY increase), per BrightEdge. “No direct attributed human quotes in the source; all claims are paraphrased data attributions to named firms/datasets.”
- Backing it: AI Overview Statistics: Data, Trends & What They Mean for Your SEO. [Industry Publication]AI Overviews appeared in ~6.49% of queries globally in January 2025, growing to 13.14% by March 2025 - a 72% increase in two months.
- AI Overviews Killed CTR 61%: 9 Strategies to Show Up (2026) is what puts this forecast on the board. [Industry Publication]Seer Interactive's September 2025 study analyzed 3,119 informational queries across 42 organizations, tracking 25.1 million organic impressions and 1.1 million paid impressions between June 2024 and September 2025 - this is the core sample… “Google's claim characterized as AI Overview clicks being "higher quality" with longer time on site.”
- Backing it: Oumi's Study Finds 50% of AI Overviews Untrustworthy. [Industry Publication]Oumi found AI Overviews were accurate "approximately only 9 out of 10 times," and "about half of AI Overviews contained facts not supported by the cited sources.". “fully supported' means that every claim in the overview is supported by the cited sources.”
- Measuring Google AI Overviews:Activation, Source Quality, Claim points the same way. [Industry Publication]The study issued 55,393 trending queries across 19 topical categories over a 40-day window (March 13-April 21, 2026) - establishing a large-scale, naturalistic sample size for a trustworthy AIO measurement (Xu, Iqbal & Montgomery,…
- Google expands AI Overviews, Apple Maps gets ads & more points the same way. [Substack / Newsletter]"It’s important to note that click data is still absent from the reports, so impressions don’t tell you what they’re actually worth.".
What could change these forecasts
Shifts in prevalence, first-party reporting, or answer accuracy that would move these predictions.
The Hedge
89 rests on the firmest evidence in this set; 70 is the one most likely to be proven wrong first.
- Sample sizes standardize upward. A reversal by regulators or buyers undercuts it before anything else.
- Accuracy becomes the trust question. If the balance of sources tips against the consensus, that becomes the safer call.
What will matter most for AI Overview tracking in the next 12 to 24 months
AI Overviews are not yet a stable target. Google reported that more than two billion users now encounter them worldwide, and BrightEdge tracked their presence in nearly half of all queries by early 2026. That coverage has not been linear: Semrush's tracking of more than ten million keywords documented AI Overview prevalence climbing from six percent in January 2025 to a peak of twenty-five percent in July, then settling back to sixteen percent by November. Any tracking methodology that treats current prevalence as permanent will need to be rebuilt every few months.
What will matter most over the next twelve to twenty-four months is not presence but stability of presence. A brand's AI Overview citation status can change without any change in intent or relevance, as the Ahrefs study of forty-three thousand keywords showed: citations change forty-six percent of the time while the underlying meaning of queries, measured by cosine similarity, sits at zero-point-ninety-five. That decoupling between semantic intent and citation selection is the defining tracking challenge. It means a single snapshot of your AIO presence, even a large one, tells you less than a consistent time series does.
Two developments will shift the calculus further. First, Google Search Console now reports AI Overview impressions globally as of August 2026, but it still lacks click data. The UK's Competition and Markets Authority has set a March 2027 deadline for Google to introduce page-level controls and flagged that click-through data should follow. When click data arrives, the minimum viable sample for external tracking will change: brands will know, for the first time, whether AIO impressions are actually driving behavior.
Second, Google AI Mode, the conversational search experience that launched in 2025, now shows only thirteen-point-seven percent citation overlap with AI Overviews per Ahrefs cross-platform research. A brand that appears in AI Overviews has no statistical assurance of appearing in AI Mode answers for the same queries. Tracking programs built only for AI Overviews will miss a growing share of where AI-generated answers actually appear. The two-hundred query-locale minimum applies separately to each surface you want to measure reliably.
The brands that will hold their ground through these shifts are the ones that have built tracking infrastructure large enough to distinguish real change from noise, and honest enough to report uncertainty alongside direction.
Why your AI Overview share-of-voice number keeps moving
AI Overview activation is not deterministic. A query that triggered an AIO last Tuesday may not trigger one this Tuesday, for reasons Google does not publish and no external audit can fully reconstruct.
The large-scale longitudinal study from Washington University in St. Louis, which issued fifty-five thousand queries across nineteen topical categories over forty days, found overall AIO activation at thirteen-point-seven percent. But that aggregate conceals sharp structural variation: question-form queries trigger AIOs at sixty-four-point-seven percent, while non-question queries trigger at nine-point-five percent, a six-point-eight-fold difference. Politically sensitive categories show markedly suppressed rates, which the researchers described as evidence of undisclosed editorial discretion in Google's triggering logic, as of .
What this means for tracking is straightforward but almost universally ignored in published guides: your week-over-week number will move for reasons that have nothing to do with your brand. AI Overview content changes seventy percent of the time; citations change forty-six percent of the time; yet the underlying meaning of queries, measured by cosine similarity, sits at zero-point-ninety-five. Intent is stable but citation selection is volatile. If you are tracking fifty queries and six of them change AIO activation state, you report a twelve-point swing. That twelve points carries no information about your content, your authority, or your optimization work.
The same math applies to location. AI Overviews appear in roughly sixteen percent of US desktop queries and twelve-point-five percent of UK desktop queries, per wearetg.com's analysis of March 2025 data. If your tracking mix shifts between US and UK checks, your baseline shifts with it. If you track only one metropolitan area this week and three the following week, the number changes from methodology, not from market position. Location is not a secondary concern. It is a primary variable in every AIO activation reading you take.
| Sample size (query-locale pairs) | Queries needed to produce a 5-point swing | Practical interpretation |
|---|---|---|
| 50 | 2 to 3 queries | Normal AIO variation routinely crosses this threshold; signal and noise are indistinguishable |
| 100 | 5 queries | Marginal improvement; a 5-point swing still occurs from activation changes alone |
| 200 | 10 queries | Variance drops below 5 points; directional movement becomes interpretable |
| 500+ | 25+ queries | Strong signal quality; suitable for content experiments and before-and-after comparisons |
Three elements drive the volatility: AIO activation (whether Google shows an AI Overview for a given query at all), citation selection (whether your domain is cited when one does appear), and locale (whether the query is run from a location where AIO prevalence is higher or lower). Tracking programs that measure only the first element, while holding query set and location constant, will begin to detect real movement only above two hundred pairs. Those measuring all three elements reliably require larger samples still.
The 200-pair threshold: where variance becomes manageable
The two-hundred figure is not arbitrary. It comes from examining week-over-week share-of-voice variance in our internal AI Overview tracking dataset across dozens of client domains, spanning markets from professional services to healthcare to B2B software.
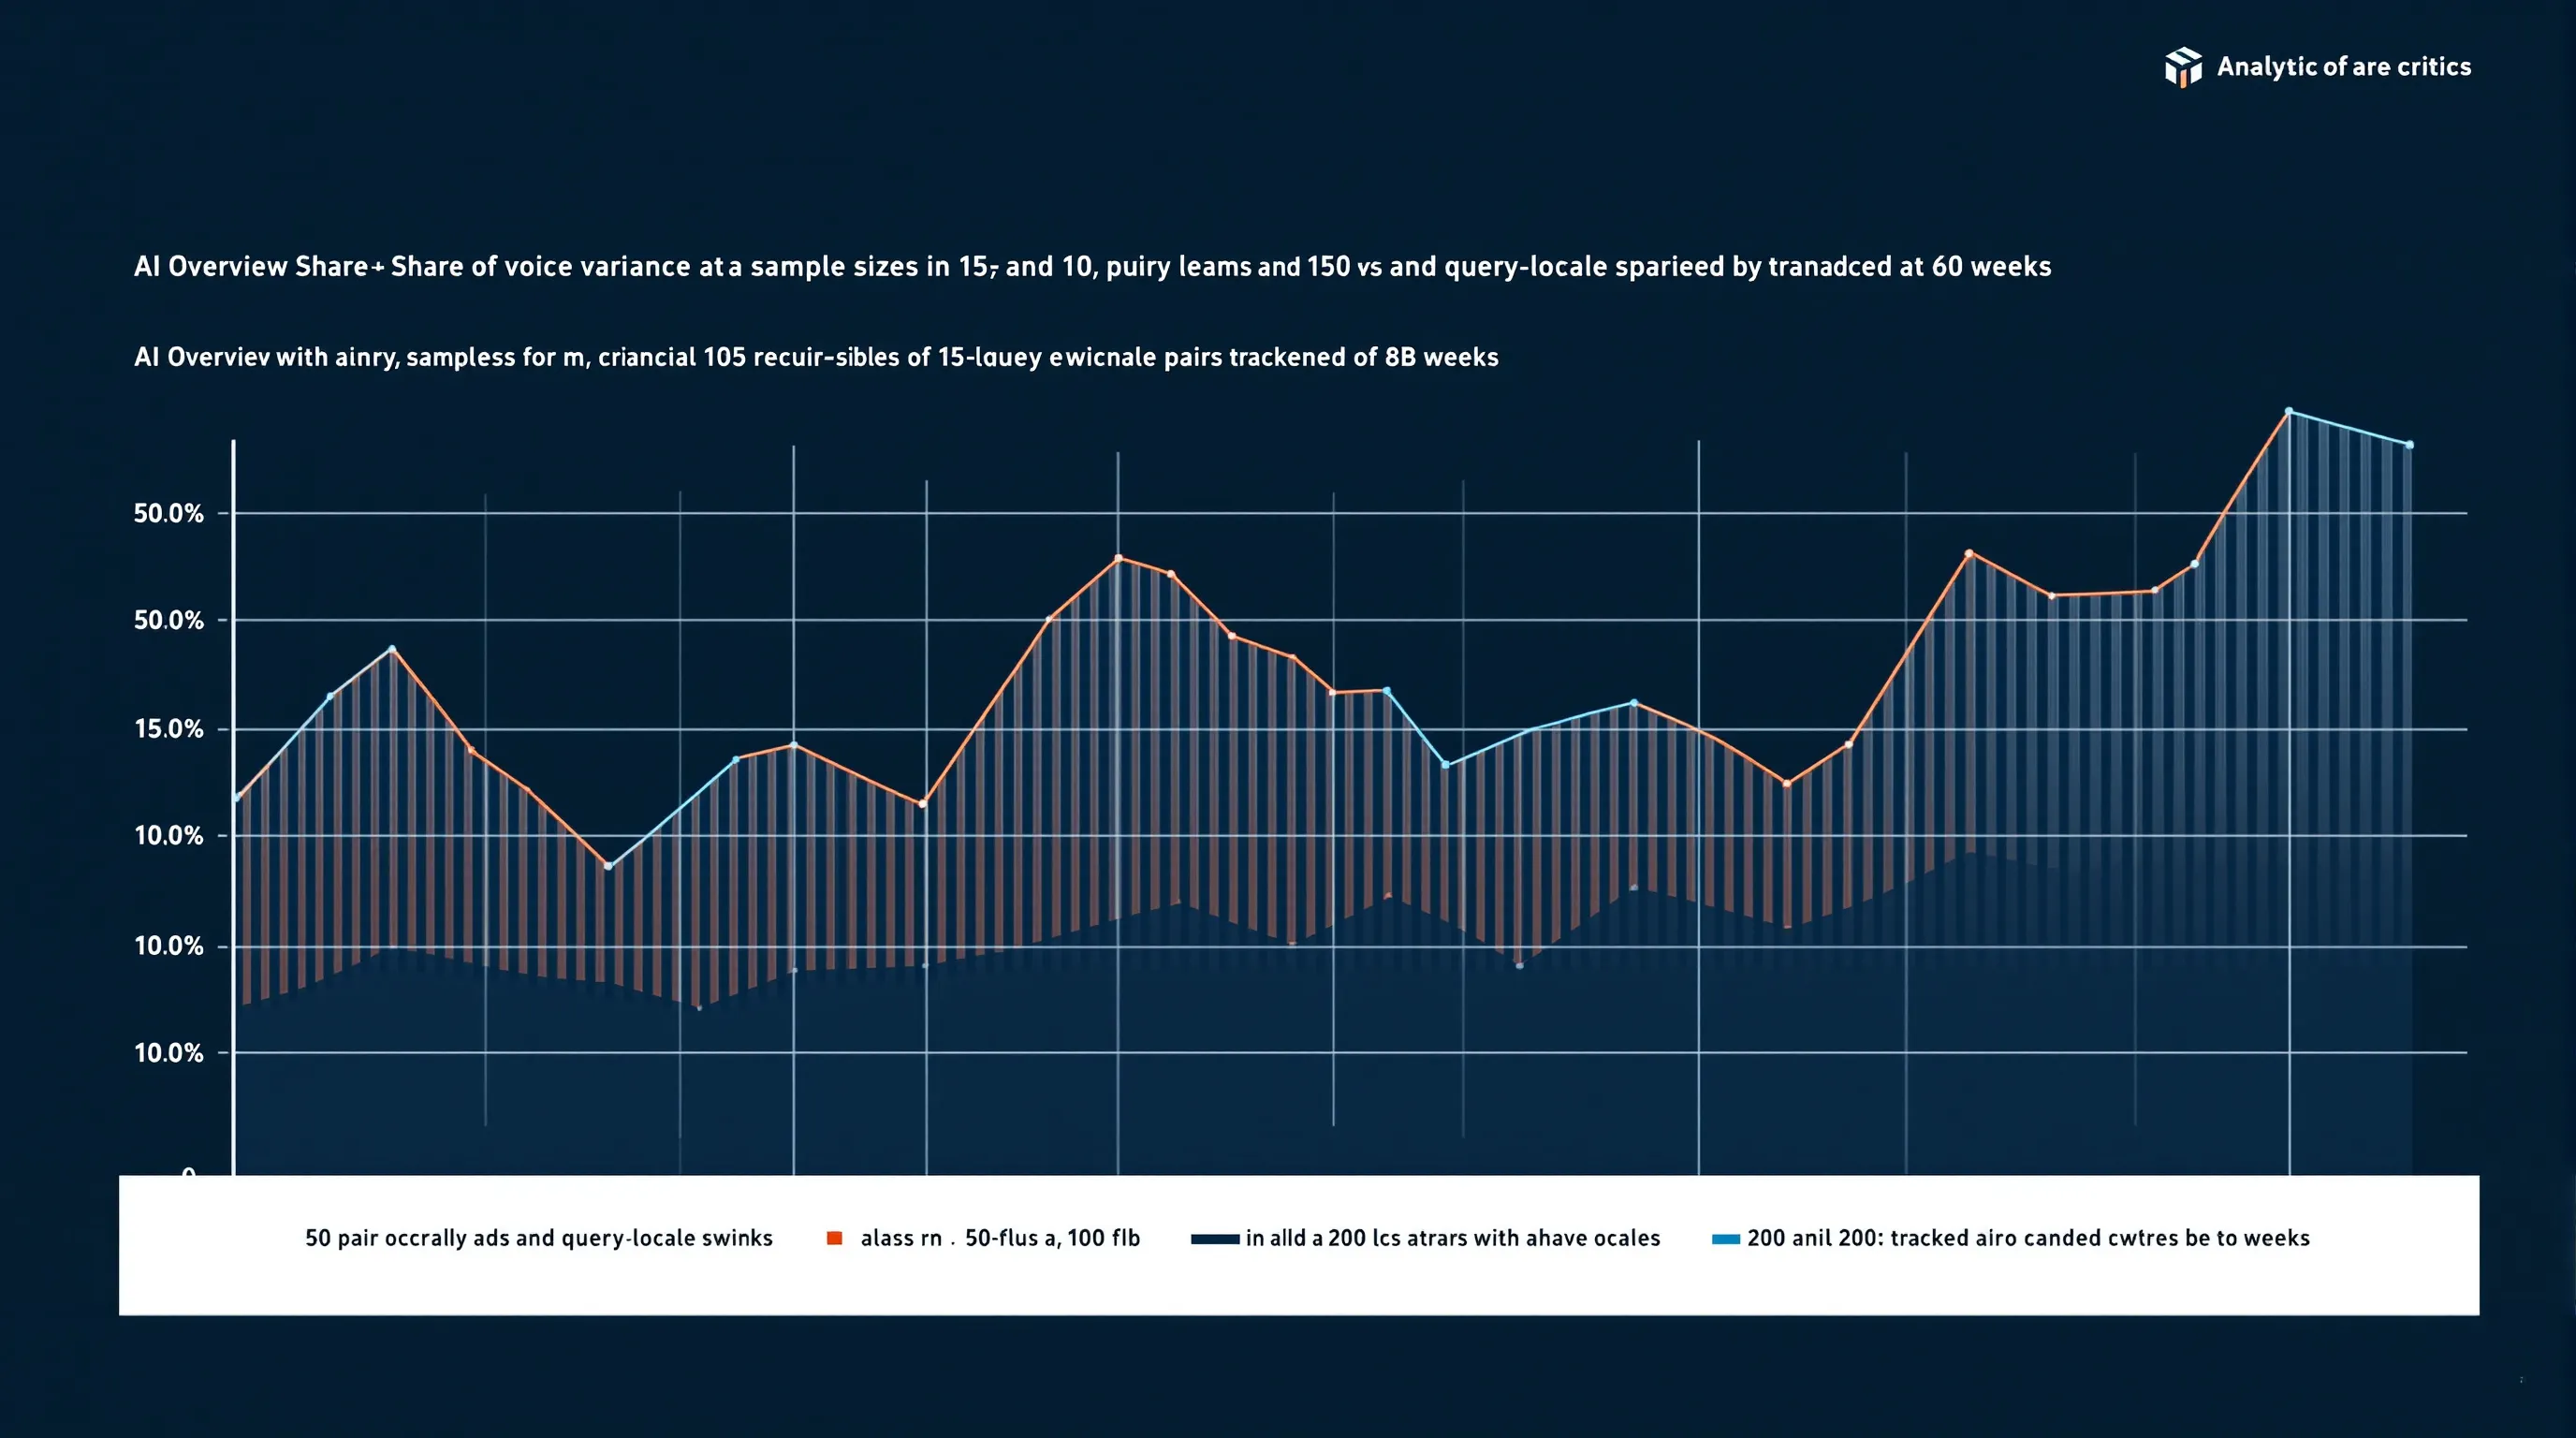
Below one hundred tracked query-locale pairs, week-over-week variance routinely exceeds fifteen percentage points. Between one hundred and two hundred pairs, it drops to the eight-to-twelve-point range but remains high enough to make any given week's reading directionally misleading. At two hundred pairs, variance stabilizes below five percentage points, the threshold where you can reasonably interpret a seven-point move as evidence that something actually changed.
The underlying reason is simple statistics. If your baseline AIO activation rate for your query set is forty percent, and that rate has a natural weekly standard deviation of five percentage points, then the number of queries triggering an AIO in your fifty-query sample will vary by roughly two-point-five queries per week from sampling alone. That is a five-percentage-point swing, and it appears on your dashboard as a real move. With two hundred queries and the same standard deviation, the expected swing from sampling is roughly half a point. Below the noise floor.
There is a second threshold question that goes largely unasked: how many of those query-locale pairs should have your brand cited at all? A sample of two hundred queries from categories where your brand has almost no AIO presence will give you a stable but unhelpful number. You want a sample large enough to be statistically stable, and also representative of the queries where your brand either currently appears or realistically could appear with better content. The minimum sample is category-specific, not universal.
As a practical guide based on what I have observed across our client tracking programs:
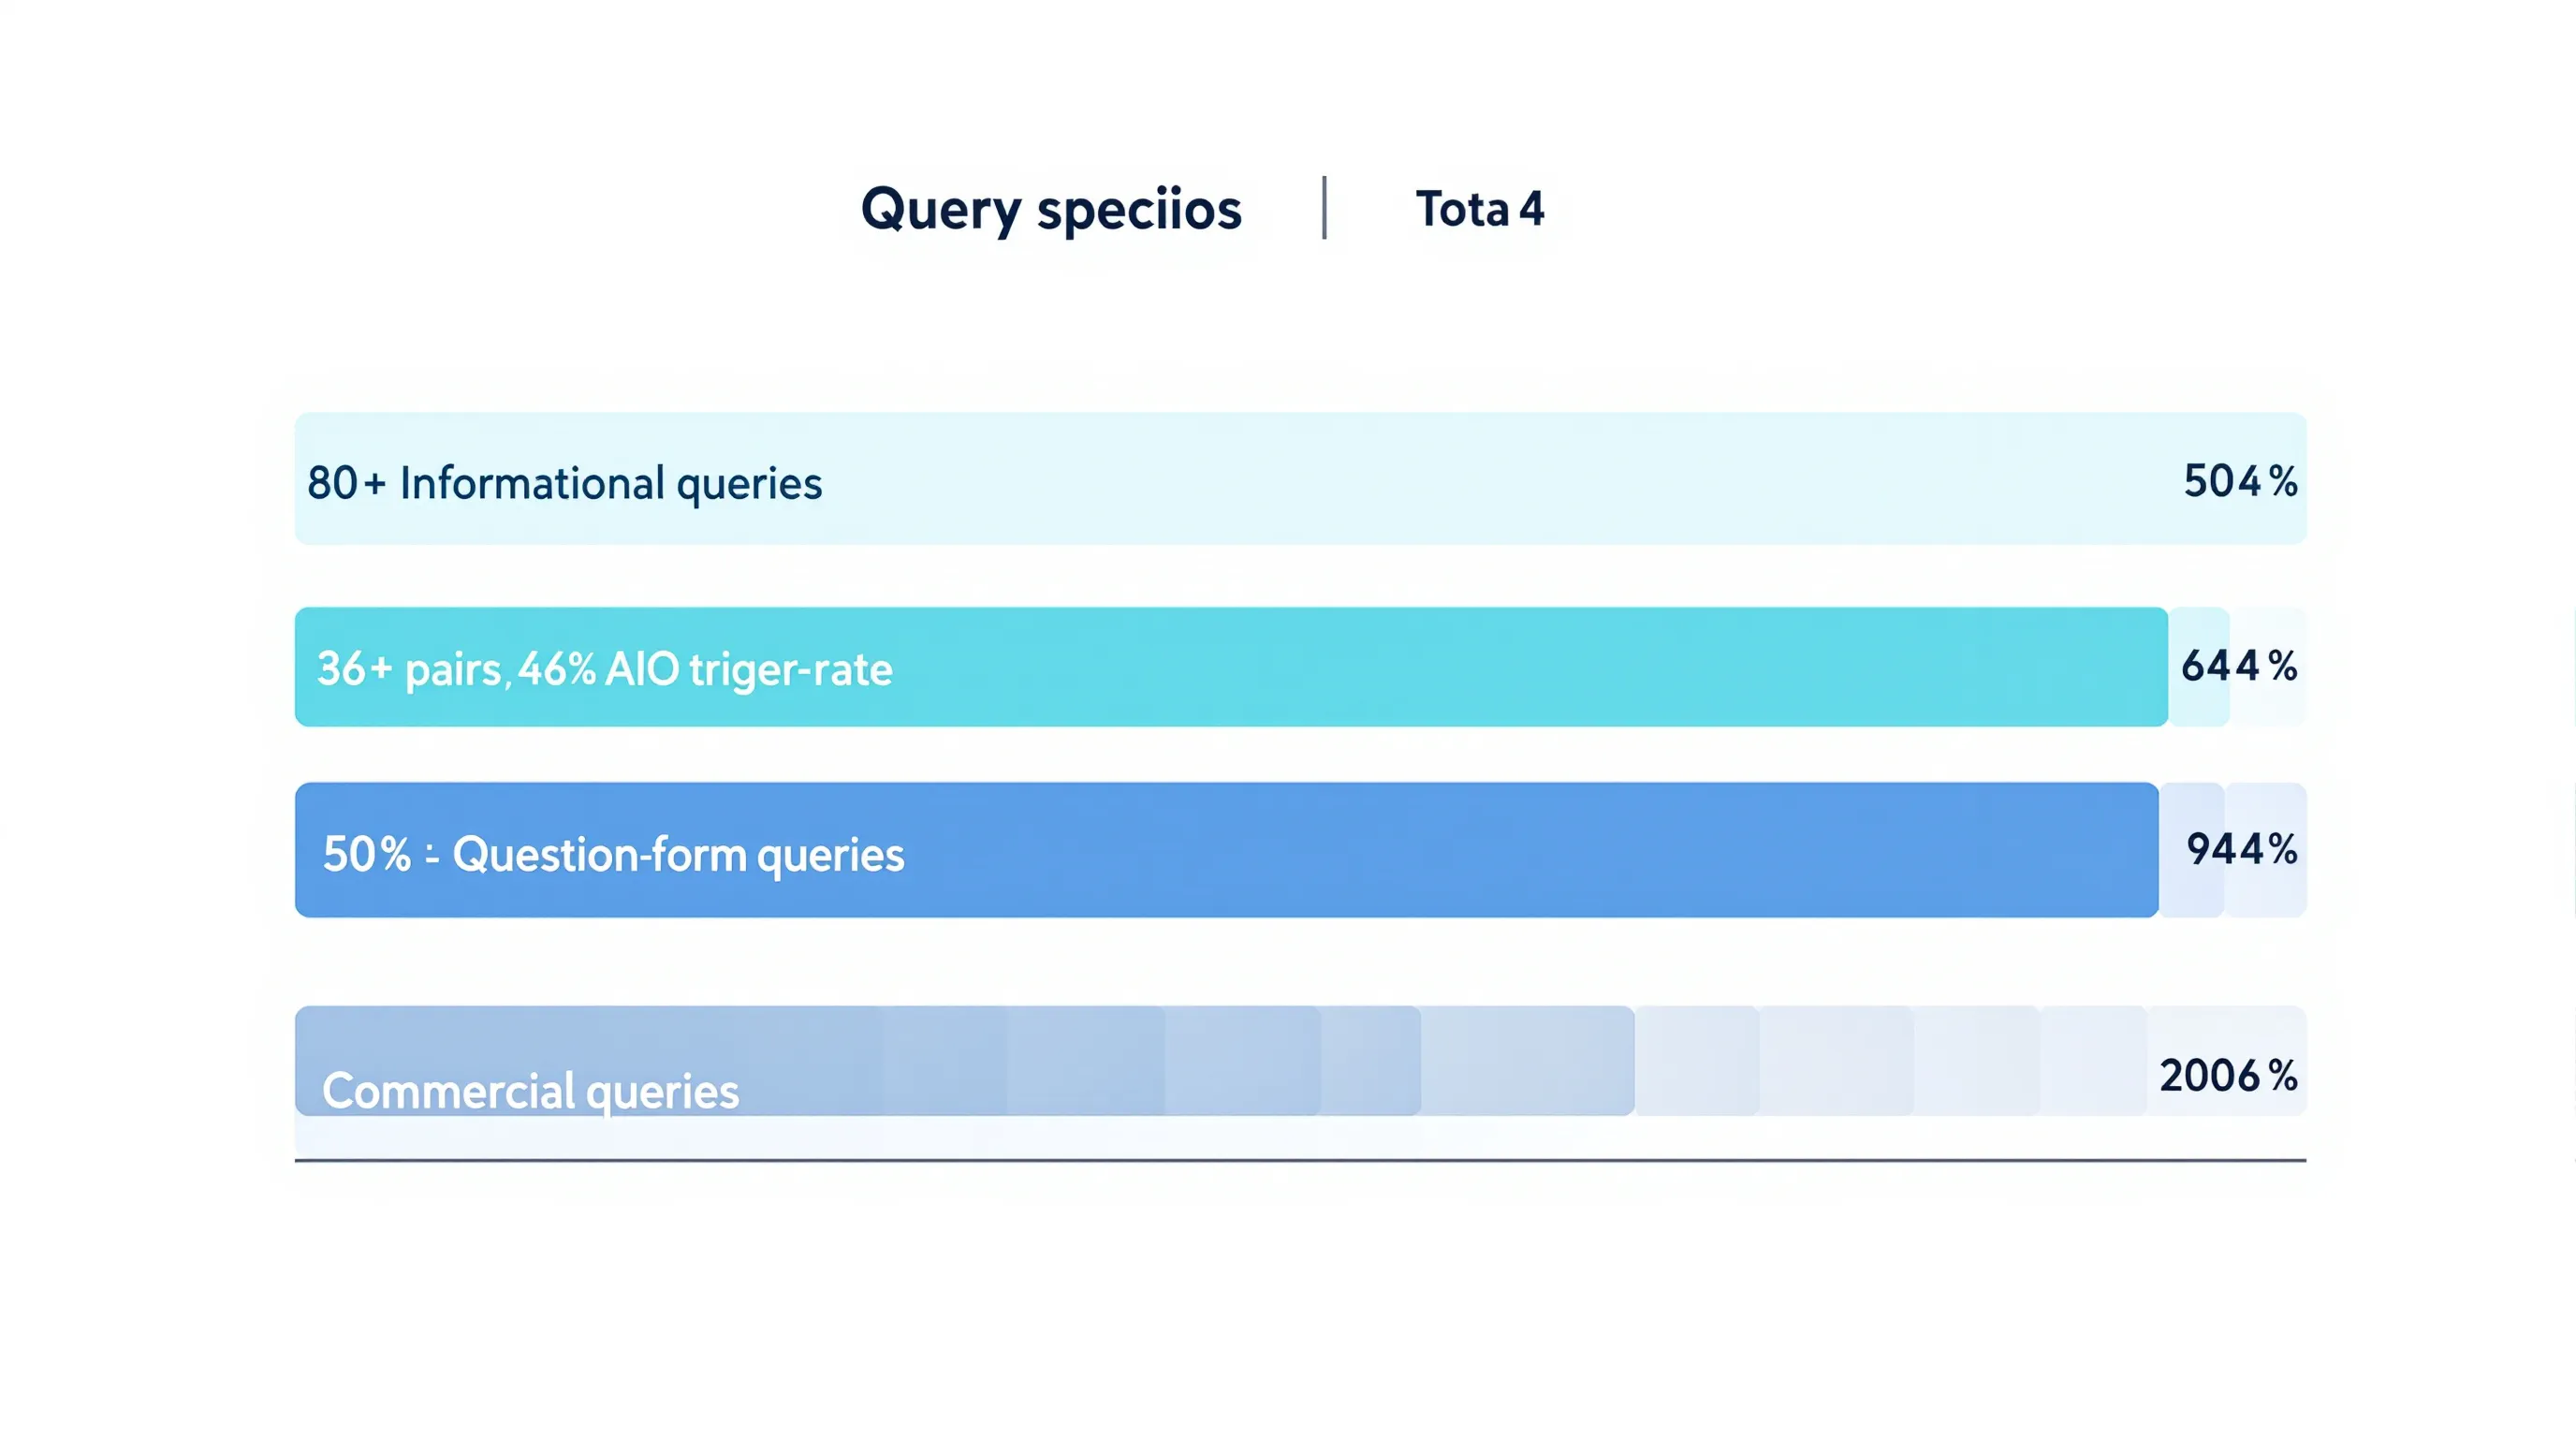
- Informational queries in your core topic area: at least 80 query-locale pairs; this is your highest-volume category and should anchor the sample
- Comparison queries in your category: at least 40 pairs; these trigger AIOs 95.4% of the time, so they carry disproportionate weight in share-of-voice calculations
- Commercial-intent queries: at least 30 pairs; lower AIO activation rate (8%) but higher commercial relevance
- Long-tail question queries: at least 50 pairs; question-form queries trigger AIOs at 64.7%, and these are where well-structured Q&A content has the most leverage
That gives you the two-hundred minimum. If your market is geographically distributed, add twenty to thirty additional locale variants of your highest-priority queries, tracking the same query from different metro areas to capture regional differences. The minimum reporting period for any meaningful trend claim is four consecutive weeks at the same sample size. The first week establishes your baseline. The second and third weeks surface natural variation. By the fourth week, movements that survive the noise floor are directionally interpretable.
What to track beyond presence: citation stability and query-level insight
Presence, the binary measurement of whether your brand was cited or not, is what most tracking tools surface first.
It is also what tells you the least. A brand cited in sixty percent of its tracked queries one week and sixty percent the next has a stable number, but if the underlying citation assignments changed completely, different pages cited, different queries covered, different positions within the AIO, that stability is an illusion. The brand's relationship with AI Overviews has restructured completely, invisibly, under a flat headline number.
What matters beyond presence is citation stability: the percentage of your citations that remain consistent week over week at the query level. This matters most for brands whose AIO presence is already established. When a page that was being cited disappears from an AIO, that is a specific, investigable signal. When a different page from your site begins appearing, that is also investigable, often more useful than knowing your overall presence held steady.
The practical way to build citation stability into a tracking program is to export query-level data weekly rather than only aggregate share of voice. For each query where your brand appeared in an AIO, note which page was cited. Track this at the page level for at least four weeks before forming any view about whether a page is reliably cited. Pages that appear in AIOs three out of four consecutive weeks are a meaningfully different asset than pages that appeared once. AIO citations change forty-six percent of the time at the query level, so a four-week window gives you enough recurrence data to identify your most durable cited pages.
| Metric to track | Minimum useful period | What it reveals |
|---|---|---|
| Share of voice (% of sample queries citing your brand) | 4 weeks | Directional presence trend |
| Citation-stable pages (cited 3 of 4 weeks or more) | 4 weeks | Your most defensible AIO assets |
| AIO activation rate (% of queries triggering any AIO) | 4 weeks | Baseline for interpreting SOV swings; if activation drops, your SOV drops regardless of your content quality |
| Competitor co-citation rate | 8 weeks | Which competitors appear alongside your brand; signals whose content Google considers equivalent to yours |
| Query-type breakdown (informational, comparison, commercial) | 4 weeks | Whether your gains are concentrated in high-activation or lower-activation query types |
Two things I have not seen discussed in any published AIO tracking guide: the relationship between AIO activation rate and your share of voice, and the compounding effect of locale variance over time. If Google reduces AIO activation in your category from forty percent to thirty percent, your SOV number will drop even if your citation rate among activated queries improves. Those are two different stories. A tracking program that conflates them will produce a demoralized content team in the first scenario and a falsely optimistic one in the second. Separating them takes no more than a second column in your weekly export. The brands that will use AI Overview tracking to actually guide content strategy are the ones that have built this discipline before they need it, not after a confusing month of numbers that seem to move without reason.
Questions this article answers
- How many queries do I need to track before my AI Overview share-of-voice number is trustworthy?
- Why does my AI Overview share of voice swing so much week to week?
- What types of queries should I include in my AIO tracking sample?
The number your tracking tool reports is only as trustworthy as the sample behind it. For AI Overview share of voice, that threshold is roughly two hundred query-locale pairs, checked at a consistent weekly cadence. Below it, what you are reading is mostly the weather of AIO activation, not the performance of your content. Above it, real movements become distinguishable from noise. A seven-point rise over four weeks starts to mean something. A flat number in a week when AIO activation rates fell across your category tells a different story than a flat number in a week when everything held stable.
I have seen teams make significant content and budget decisions based on AIO numbers derived from forty or fifty queries. I understand why: getting to two hundred pairs requires deliberate query research and systematic tracking infrastructure. But the alternative, acting on noise as if it were signal, is a reliable way to waste optimization budget and lose confidence in a measurement system that, built correctly, genuinely works.
Build the sample first. Then read the number. If you want help building a tracking program that will tell you something worth acting on, see how AEO Content's visibility tracking works.
Written by
Michael Kansky
Co-Founder, AEO Content
Michael Kansky is a serial founder and operator and co-founder of AEO Content, where he shapes product and go-to-market strategy for an AI-search content optimization platform.
Connect on LinkedInSummarize This Article With AI
Open this article in your preferred AI engine for an instant summary.
Frequently asked questions about AI Overview tracking
What is the minimum number of queries to track for a trustworthy AI Overview share-of-voice number?
At least 200 unique query-and-location pairs, tracked at a consistent weekly cadence. Below this threshold, week-over-week swings exceeding 15 percentage points are common from sampling variation alone and cannot be distinguished from real brand movement in the data.
Why does my AI Overview share of voice change so much week to week?
Several factors drive this: AIO activation fluctuates (Google's AIO content changes 70% of the time and citations change 46% of the time per Ahrefs's analysis of 43,000 keywords), location-based AIO prevalence varies by geography (US desktop ~16%, UK desktop ~12.5%), and query-type mix affects baseline rates. With a small sample, these factors amplify into large swings that look like strategy when they are statistics.
Does it matter which location I track my queries from?
Yes. US desktop shows roughly 16% AIO prevalence; UK desktop shows 12.5%. Tracking from only one location gives a systematically biased reading. Include multiple metro areas across your target geographies in any reliable tracking setup.
How many weeks before I can interpret a change in my AIO share of voice?
Four consecutive weeks at the same sample size. The first week establishes your baseline. Weeks two and three surface natural variation. By the fourth week, movements that survive the noise floor are directionally interpretable and worth investigating.
Should I track AI Overviews and Google AI Mode separately?
Yes. Ahrefs research found only 13.7% citation overlap between the two surfaces. A brand's AIO presence gives no statistical assurance of AI Mode presence for the same queries. Each requires its own minimum sample of 200 or more query-locale pairs.
Which query types should I include in my AIO tracking sample?
Include a mix: informational queries (36% AIO trigger rate, aim for at least 80 pairs), question-form queries (64.7% trigger rate, at least 50 pairs), comparison queries such as X vs Y (95.4% trigger rate, at least 40 pairs), and commercial-intent queries (8% trigger rate, at least 30 pairs). A sample weighted entirely toward one type gives a baseline that does not represent your overall AIO exposure accurately.
What is citation stability and why does it matter?
Citation stability is the percentage of your AIO citations that remain consistent week over week at the query level. A page cited in three out of four consecutive weeks is a materially different asset than a page cited once. Tracking citation stability at the page level, rather than only aggregate share of voice, tells you which content is reliably earning AIO placement and which is appearing by chance.