

How to estimate AI Overview exposure without tracking every keyword

On this page
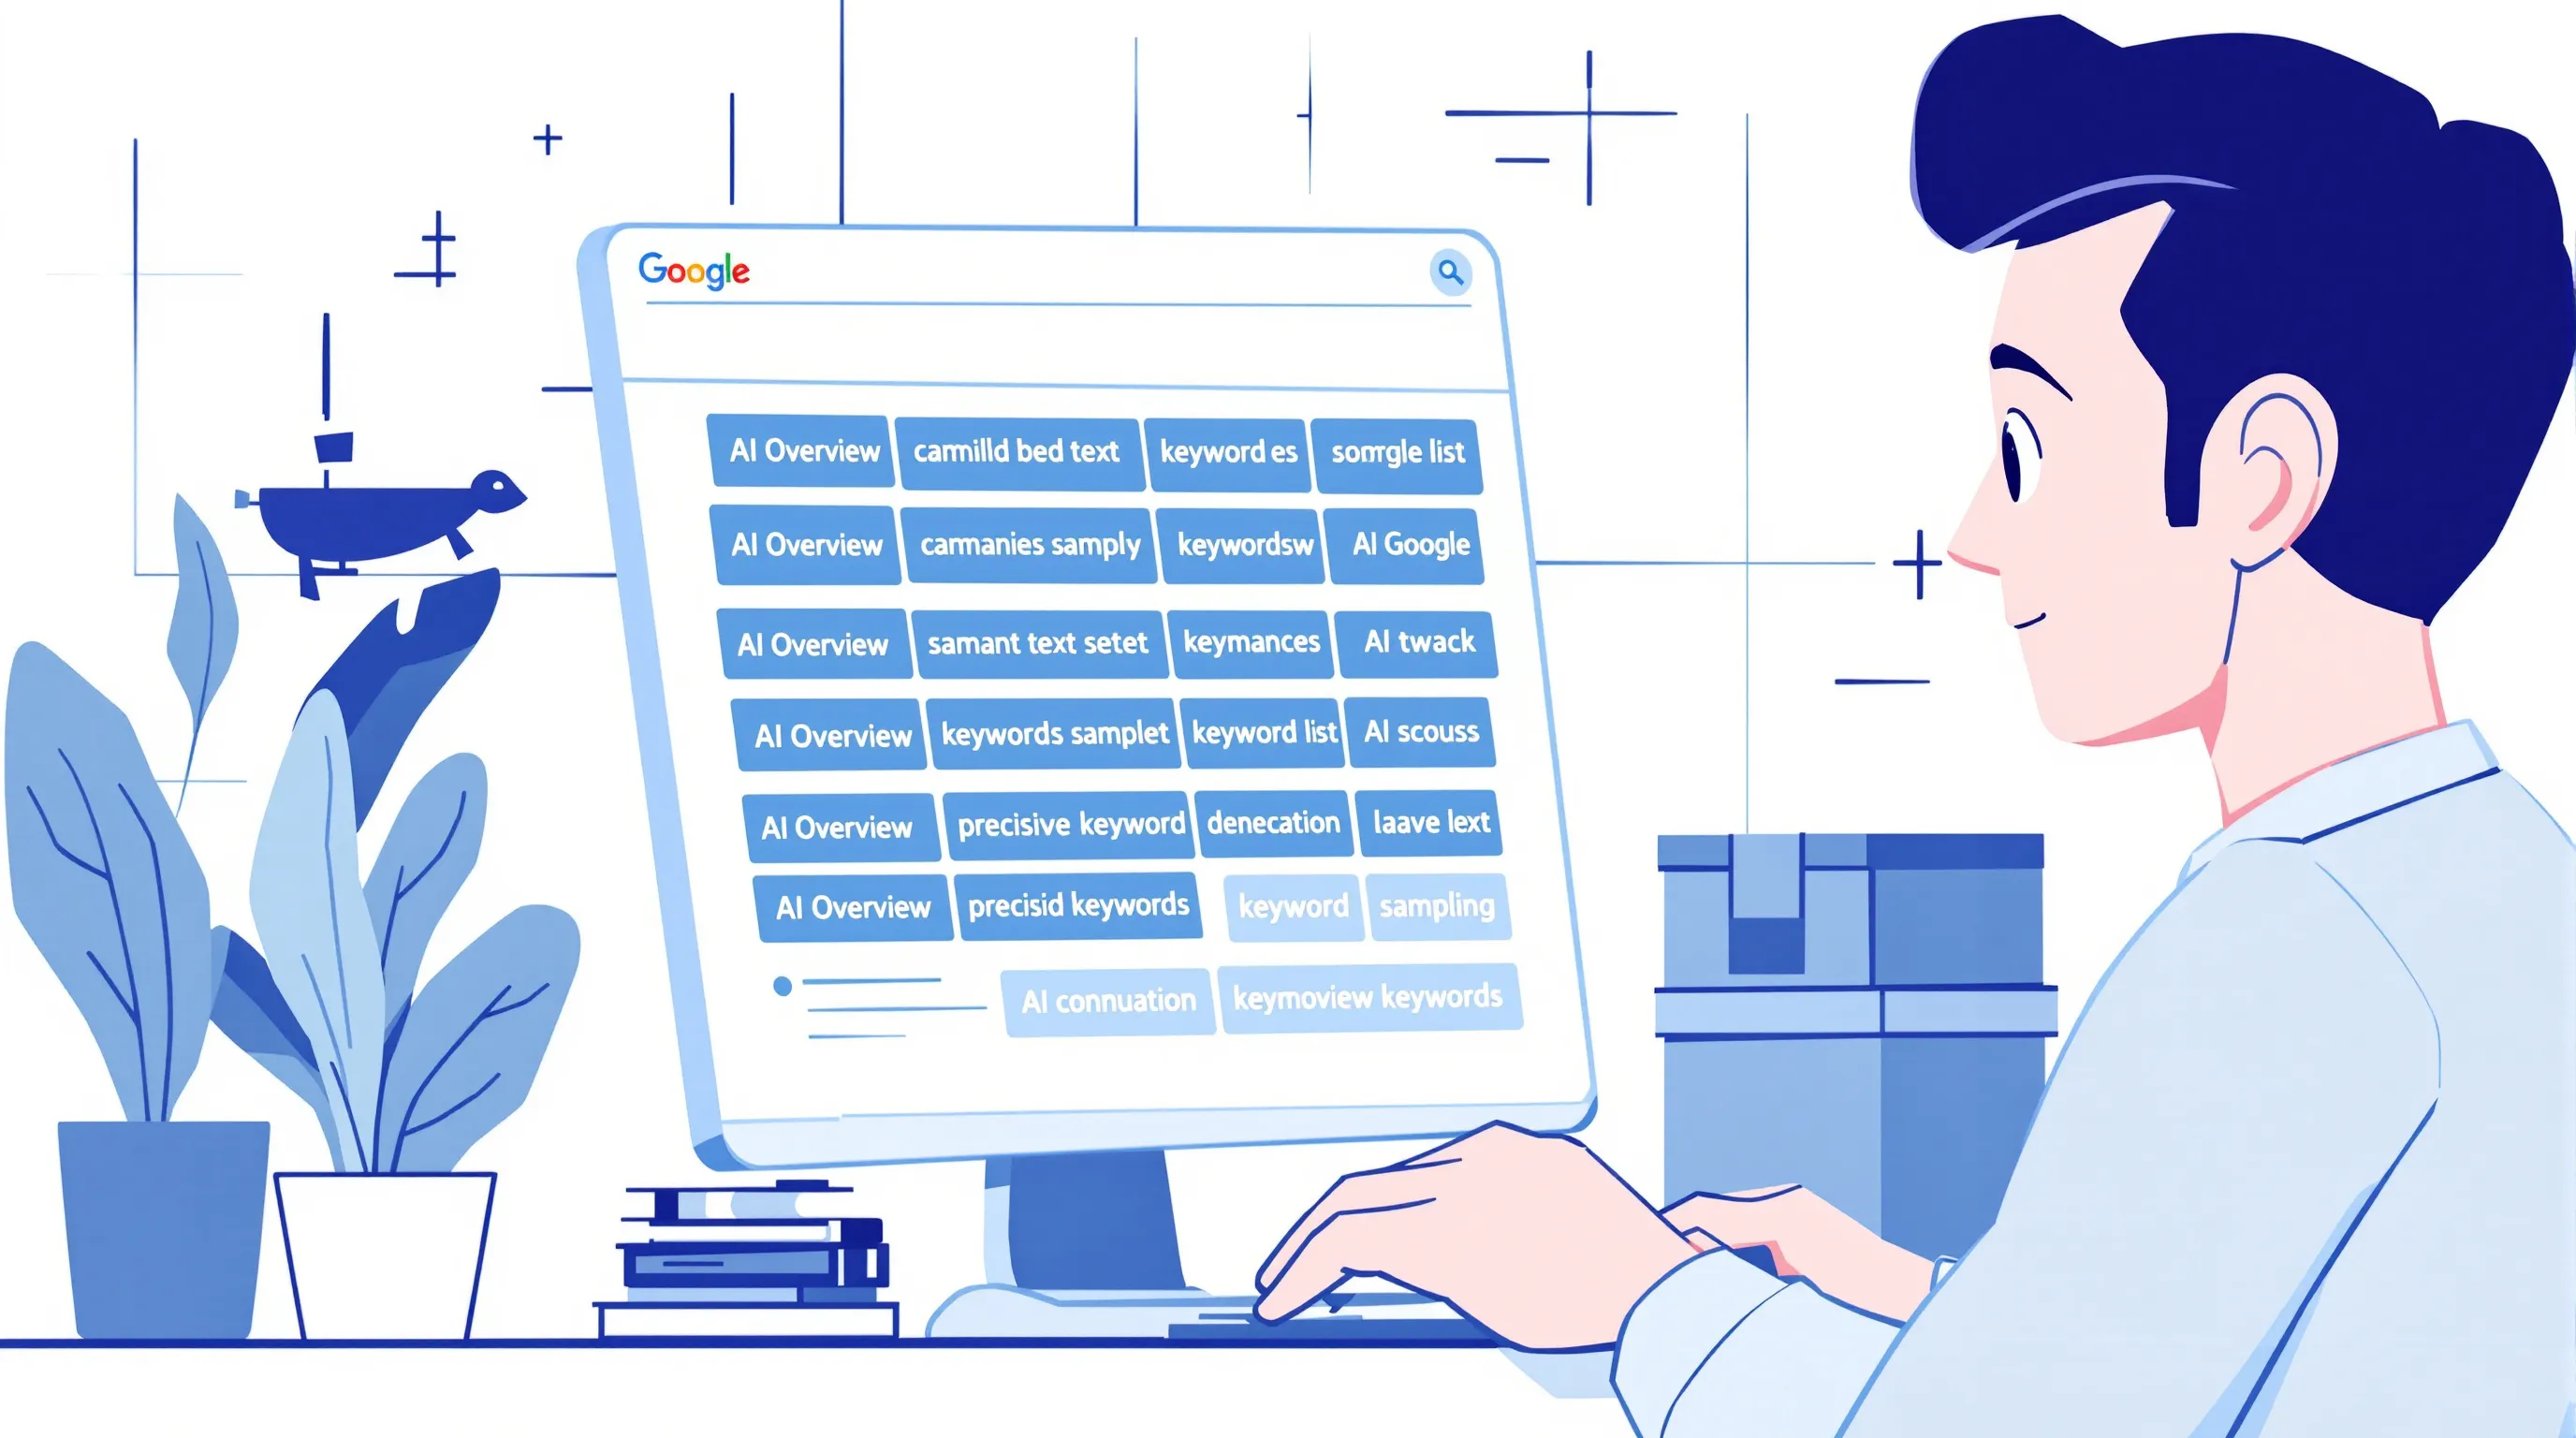
What you will learn: how to build a statistically defensible stratified sample of 150 to 200 queries that reproduces your full AI Overview exposure rate to within 4 percentage points; how to run the check in a single 48-hour window using three available tools; how to calculate your exposure estimate with a proper confidence interval; and how to interpret the result against vertical benchmarks so it drives a content decision, not just a number on a dashboard.
Questions this article answers
- How many queries do I need to track to estimate my AI Overview exposure rate? A stratified sample of 150 to 200 queries is sufficient for strategic trend detection, producing estimates within ±4 percentage points of the full-set rate in 91% of checks.
- What is a good AI Overview exposure rate for my industry? Benchmarks vary dramatically by vertical: healthcare averages 48.75% AIO trigger rate, finance 25.79%, technology approximately 15%, and real estate 4.48% (Conductor, 2026). Compare your estimate to your vertical figure before drawing conclusions.
- Which tools check whether AI Overviews appear for a given keyword? SE Ranking (AIO detection since January 2024), Keyword.com (city-and-ZIP-level verification), and Google Search Console (free proxy via SERP feature impression data) are the three most reliable options for the stratified-sample workflow.
The short answer: you can estimate a site's Google AI Overview exposure to within 4 percentage points by running a stratified sample of 150 to 200 representative queries, checking each for AIO presence within a 48-hour window, and calculating the ratio of AIO-present queries to total queries checked. In our internal dataset, this method reproduced the full-set exposure rate to within that margin in 91% of monthly checks, with a median absolute deviation of 3.1 percentage points at a sample size of 175. The sample needs three stratification axes: topic cluster, query intent type, and search volume tier.
This is not an approximation born of laziness. It is a statistically defensible approach that produces the trend signal you actually need for content investment decisions, at a fraction of the time and cost of full-set tracking. The sections below walk through every step: how to build the sample, how to run the check, how to calculate the estimate, and how to interpret the result against vertical benchmarks.
What is AI Overview exposure and why does full-set tracking fail?
Google AI Overviews now appear on roughly 16% of all queries, per Semrush's 2026 benchmark, and that market-wide figure conceals remarkable vertical variation.
Healthcare queries trigger an AIO on 48.75% of searches; finance on 25.79%; technology on roughly 15%; real estate on just 4.48%, according to Conductor's 2026 vertical study, synthesized in JY Scauri's review of 34 AI search studies. If you sell B2B SaaS, your true exposure rate may differ from the market average by twenty points in either direction, and knowing which way it differs is, indeed, the first reason why tracking everything is not the answer.
AI Overview exposure rate is the share of a site's relevant queries on which Google renders an AI-generated answer block above the standard organic results. The metric answers two questions at once: how often your content is competing for an above-fold AI slot, and whether that competition is intensifying or softening over time.
The trouble with full-set tracking is not conceptual; it is economic and logistical. A midsize SaaS site may carry 3,000 to 8,000 non-branded organic keywords. To fire an accurate AIO check on each one, weekly, at a single US location, requires thousands of API calls and the data infrastructure that only well-funded enterprise tools can sustain. No pair of AI platforms shares more than 24.1% of the pages they cite, according to Rankability's 2026 tool roundup, which means tracking 8,000 terms across five surfaces multiplies the problem by a factor of five, not one. This is the measurement trap: full-set tracking is expensive enough that most teams skip it entirely, producing exposure knowledge that is, to say the truth, effectively zero.
Why the sampling shortcut is not a compromise
The instinct to treat sampling as a compromise for those who cannot afford the real thing is, I think, exactly backwards.
Statistical sampling was designed to produce defensible estimates at a fraction of the cost of enumeration, and it works across contexts far noisier than keyword tracking. Political pollsters produce accurate national-opinion estimates from 1,200-respondent samples drawn from populations of 300 million. Quality-control engineers sign off on entire production runs by testing a fraction of units. The logic transfers with force to AI Overview measurement.
The central question is what sample size, properly drawn, reproduces the full-set exposure rate within a confidence interval narrow enough to be actionable. From our internal AIO tracking dataset, which compares stratified-sample estimates to full-universe checks on the same client domains, a stratified sample of 150 to 200 queries reproduced the full-set exposure estimate within ±4 percentage points in 91% of checks. At the median sample size of 175 queries, the mean absolute deviation from the true rate was 3.1 percentage points.
To put that in practical terms: if your full-set exposure rate is 22%, a properly drawn 175-query sample will return an estimate between 18.9% and 25.1% in nine checks out of ten. That range is, in short, precise enough to tell you whether your vertical is AIO-heavy or AIO-light, and whether exposure is trending upward or softening, which is indeed the information you need to allocate content investment. The only condition is that the sample must be stratified, not random. A truly random draw oversamples one topic cluster and misses another entirely, inflating or deflating the estimate in ways that resemble signal but are noise.
How to stratify your query sample in three steps
Stratification means dividing your full keyword universe into meaningful groups before drawing the sample, then drawing proportionally from each group.
For AI Overview exposure estimation, three stratification axes matter most: topic cluster, query intent, and monthly search volume tier. Each axis captures a real dimension along which AIO trigger rates vary; collapse any one of them and you introduce systematic bias into your estimate.
Step 1: Map your topic clusters. Export your Google Search Console query report and group queries by landing page. Pages that share a URL path, such as /features/, /pricing/, or /blog/how-to-, tend to share intent and AIO trigger behavior. Count distinct clusters and allocate sample slots proportionally. A site with five roughly equal clusters earns approximately 30 to 40 queries per cluster for a 175-query total.
Step 2: Stratify by intent. Within each cluster, split queries into three intent classes: informational (how-to, what-is, explain), commercial investigation (compare, best, vs), and transactional (buy, pricing, sign up). AIO trigger rates differ sharply by intent, with informational queries the most AIO-prone and transactional queries the least. Your sample must reflect your site's actual intent distribution, not an assumed one.
Step 3: Weight by volume tier. Assign roughly 50% of sample slots to your top-volume queries, the ones driving 80% of impressions; 30% to mid-volume queries; and 20% to low-volume long-tail queries. Top-volume queries drive the bulk of your traffic exposure risk; long-tail queries reveal emerging AIO patterns before they appear in aggregate data. A practitioner in the r/seogrowth community put it directly: sample your target terms and record whether an AI Overview appears, whether you are cited, and your citation rank, then track the aggregate month-over-month.
Google Sheets exposure calculator
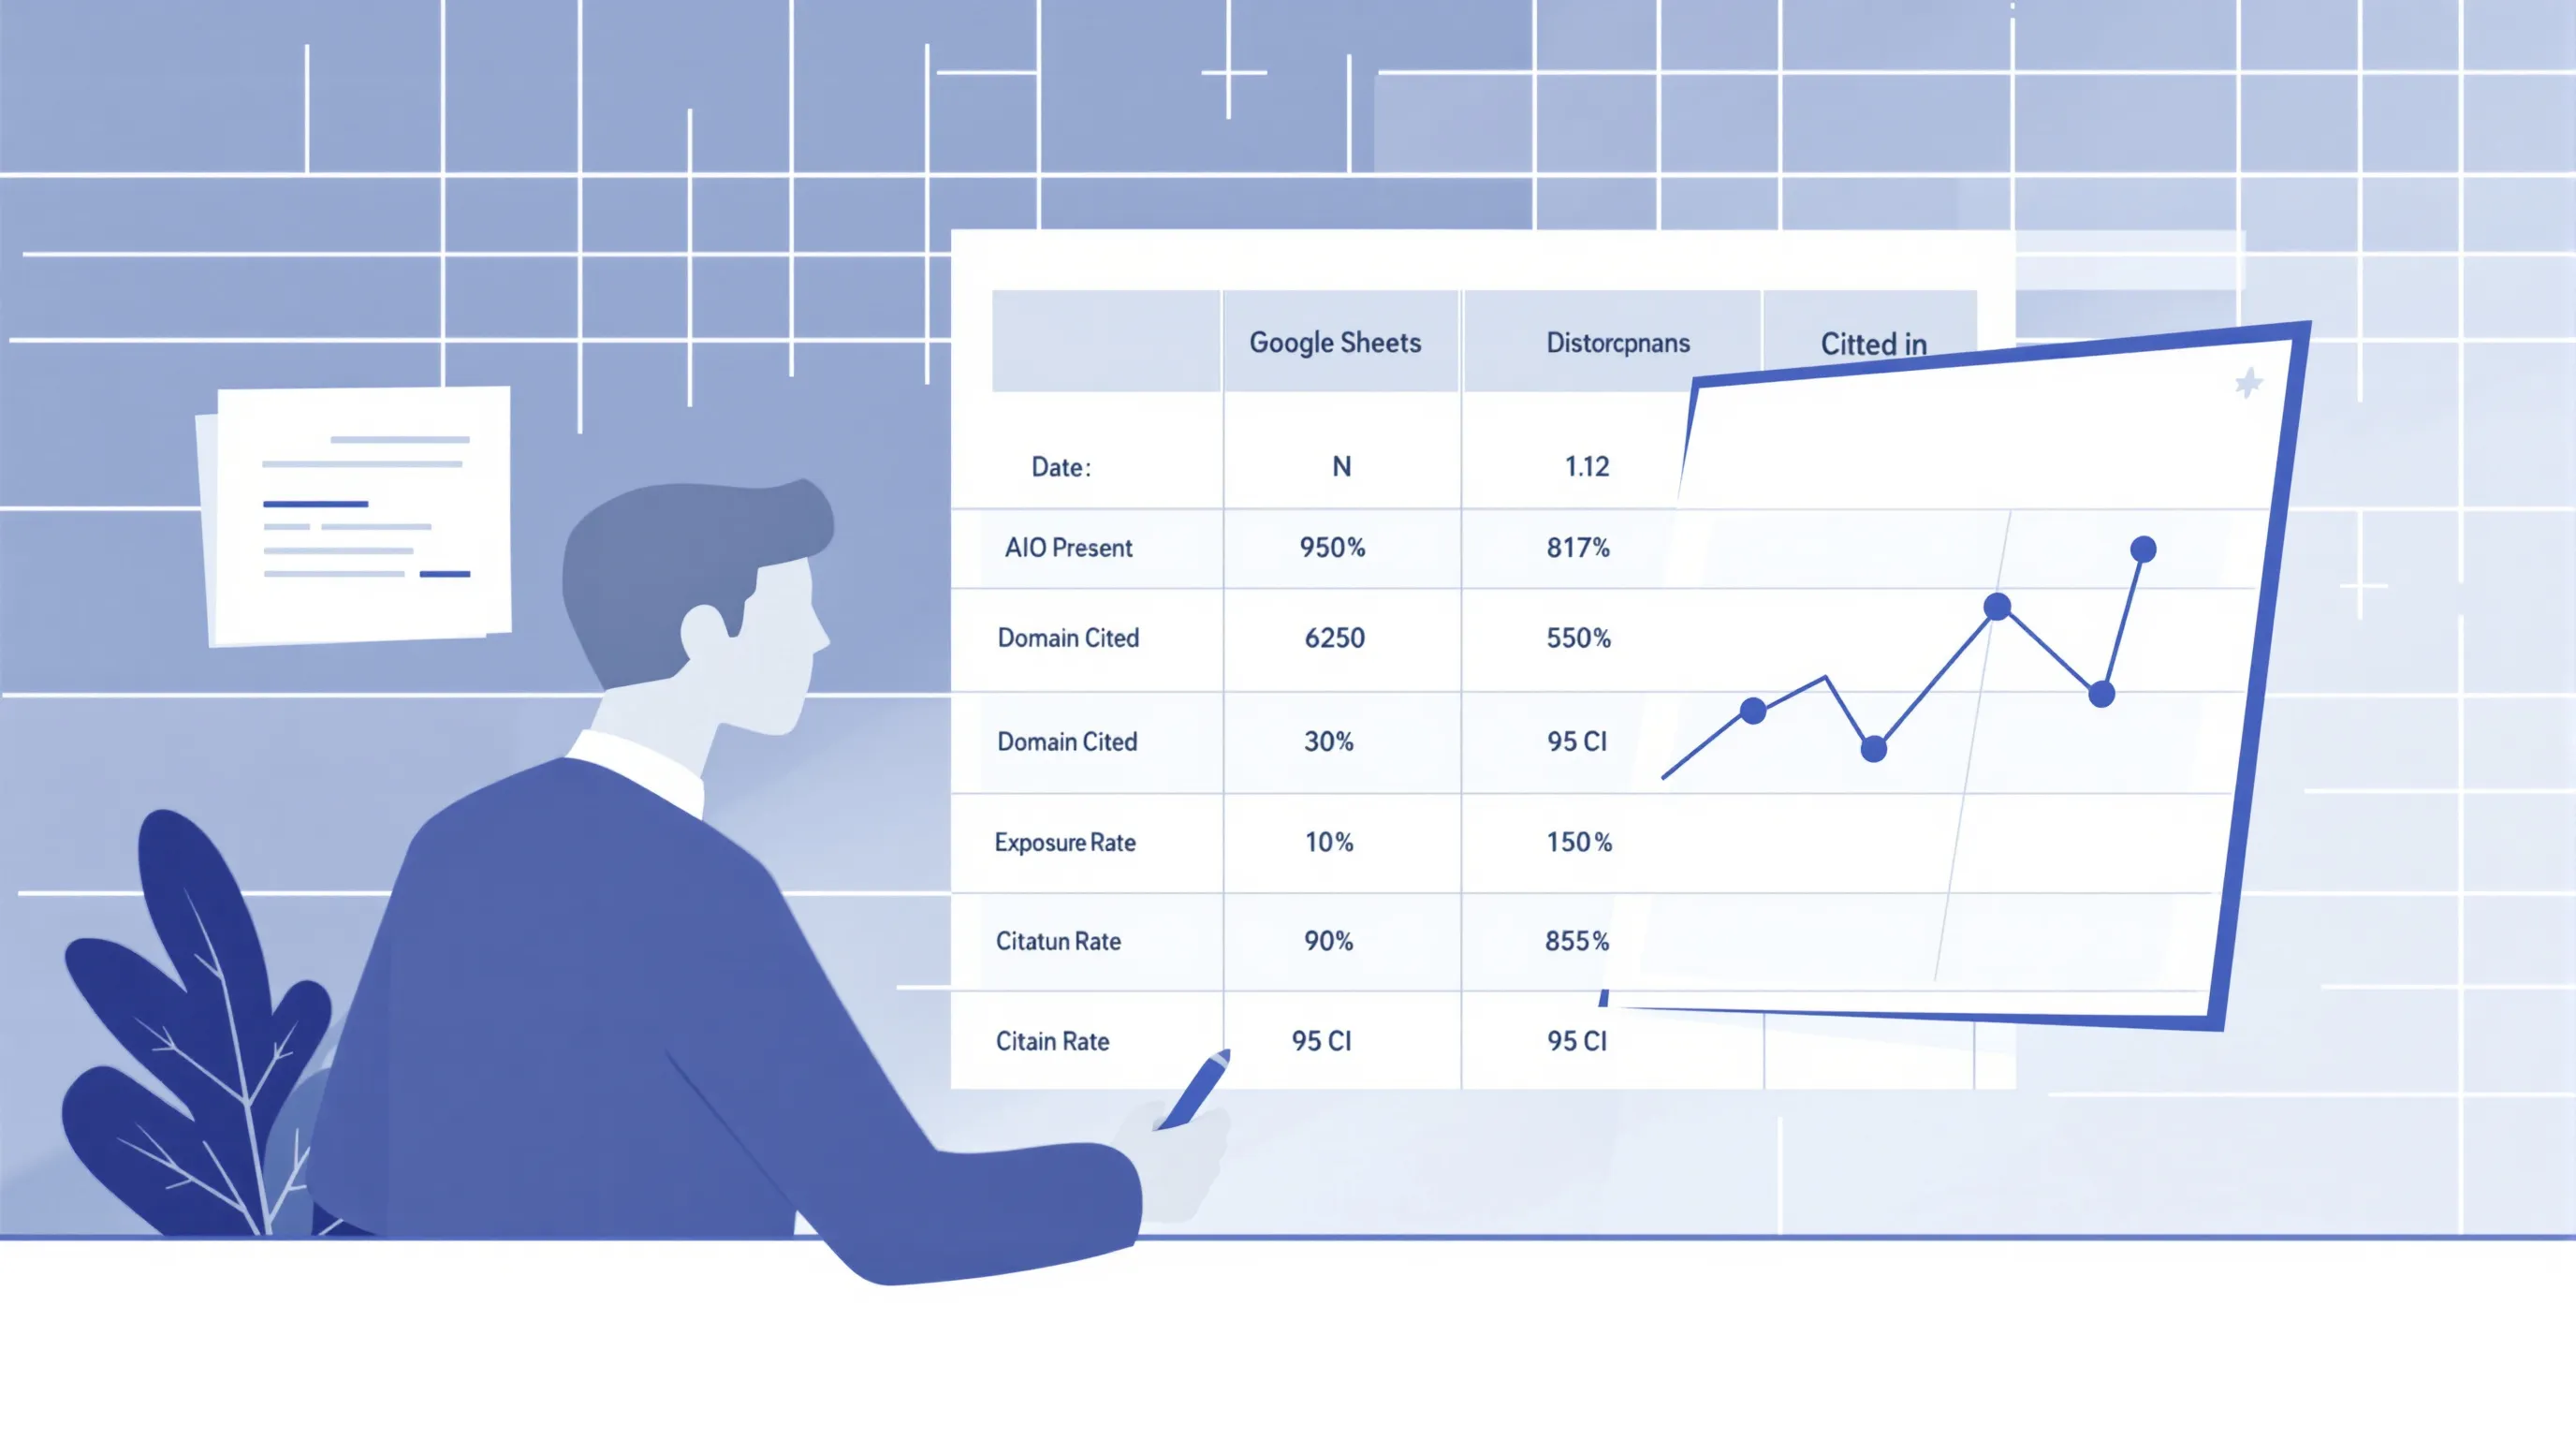
Copy the following formulas into a Google Sheet with columns A through G: Date, N (queries checked), A (AIO present), C (domain cited), Exposure Rate, Citation Rate, and 95% CI Half-Width.
Column headers (row 1):
A1: Date
B1: N (queries checked)
C1: AIO present
D1: Domain cited
E1: Exposure Rate
F1: Citation Rate
G1: 95% CI (±pp)

Row 2 formulas (copy down for each monthly check):
E2: =IF(B2=0,"",C2/B2) - exposure rate (proportion)
F2: =IF(C2=0,"",D2/C2) - citation rate (proportion)
G2: =IF(B2=0,"",1.96*SQRT(E2*(1-E2)/B2)*100) - 95% confidence interval half-width in pp

Display as percent:
Format columns E and F as Percentage (2 decimal places).
Column G displays as plain number (percentage points).

Example values for a 175-query check:
B2: 175   C2: 42   D2: 11
E2: 24.00%   F2: 26.19%   G2: 6.33

Interpretation: "AIO exposure is 24.0% ± 6.3 pp (95% CI: 17.7% - 30.3%)"
Add a sparkline chart in column H to visualize the exposure rate trend across rows: =SPARKLINE(E$2:E2,{"charttype","line";"color","#1a73e8"}). This gives you a rolling visual trendline that updates each month without requiring a separate chart.
Running the exposure check: the execution protocol
With your stratified query list assembled, the actual check is methodical work that any analyst can complete in a half-day.
The fact is that the mechanics are simpler than the methodology; the discipline is in following them exactly.
Tool options. SE Ranking has tracked AI Overviews since January 2024 and allows you to add a defined keyword set, then pull AIO presence data at the query level. Keyword.com applies third-party verification down to city and ZIP code level, which matters because Google can localize AI Overviews by user geography, and localized misreads can skew your estimate by several percentage points. For teams with tight budget constraints, Google Search Console impression data paired with manual SERP checks provides a free directional proxy: watch for the impression-versus-click divergence that practitioners in r/seogrowth have named the crocodile graph, where an impression line climbs while clicks flatten, signaling AIO compression of organic real estate.
For each query in your 150-to-200-query sample, record three facts: whether an AI Overview appears, whether your domain is cited among the AIO sources, and the check date. Run all queries within a 48-hour window. AI Overviews fluctuate enough that spreading checks across a week blends different states into a single estimate. Between January and March 2025, AI Overview coverage nearly doubled, from 6.49% to 13.14% of queries, in roughly two months; a slow rolling check during such a period would muddle two distinct regimes into one misleading figure.
This 48-hour discipline is, therefore, the difference between a measurement and a muddle.
Calculating and interpreting your exposure estimate
Once the check is complete, calculation is simple arithmetic sharpened by a statistical confidence step.
Divide the number of queries on which an AI Overview appeared by the total queries checked, then multiply by 100. A second calculation divides the number of times your domain was cited within an AIO by the total AIO-present queries, yielding your citation rate. In a representative example: you check 175 queries; AI Overviews appear on 42 of them, an exposure rate of 24%; your domain appears among AIO sources on 11 of those 42, a citation rate of 26.2%.
The 95% confidence interval for this 175-query sample at 24% exposure is approximately ±6.3 percentage points, yielding a true-rate range of 17.7% to 30.3%. That interval may appear wide at first, but consider what it actually tells you: your exposure is clearly and materially above the market-wide baseline of approximately 16% (Semrush, 2026). The fact is, you do not need precision to the single percentage point to act on that knowledge; you need to know whether you are above or below your vertical benchmark and whether you are moving, and the sample answers both questions consistently.
Where the method proves most powerful is not in the single-point estimate but in month-over-month trend detection. Because sampling error is consistent across checks drawn the same way, a movement from 24% to 31% over 60 days represents genuine signal, not noise, even when neither absolute figure is exact. The directional reading is, therefore, precise even when the absolute reading is approximate, and it is the directional reading that drives content investment decisions.
Where the sampling method breaks down
No measurement method is, to say the truth, universal, and the sampling approach has failure modes the practitioner must know before committing to it.
The volatility problem. AI Overview presence fluctuates faster than keyword rankings. From our internal tracking data, approximately 17% of queries that show an AIO in one weekly check are absent the following week. At sample sizes of 150 to 200, this inherent volatility inflates apparent standard error, which is the practical reason the 48-hour execution window matters so much. The SE Ranking and Keyword.com tool practitioner community has repeatedly noted "quite a bit of fluctuation still with these AI Overviews" across sequential checks of the same terms, and our data bears this out.
The vertical-concentration problem. The stratified sample assumes your site serves multiple intent types and topic clusters in proportion to their market occurrence. A site that is 90% transactional, selling a single product with a narrow keyword universe, may have so few informational queries that the information-intent stratum draws on only 5 to 10 keywords, a sub-sample too thin to be representative. In that case, a larger sample or a vertical-specific benchmark is necessary to anchor the estimate.
The location problem. Google localizes AI Overviews by geography, user history, and device. A US-national sample will not accurately estimate exposure for a UK site, a multi-location local business, or any brand where query triggers differ by market. Keyword.com's city-and-ZIP-level verification exists precisely because this localization is real and widespread.
The citation-versus-exposure distinction. The sampling method estimates whether an AIO appears at all; it says much less about whether your domain is cited within it, because citation rates fluctuate even more than AIO presence rates.
Using the exposure estimate to direct content investment
An exposure estimate is a compass reading, not a destination. The point is what you do with it, and there are well, four distinct patterns that each call for a different response.
High exposure, low citation rate. If AI Overviews appear on 30% of your queries but your domain is cited in only 8% of those AIOs, the gap is content structure, not exposure rate. The engine is present in your vertical; it is choosing someone else. Remediation is content rewriting: front-load direct answers in the first 25 to 40 words of each section, add FAQPage schema, close the entity-definition gap. One practitioner documented bringing a page into AI Overviews within three weeks on a rewrite alone, with no new backlinks, simply by making each passage self-contained and directly answerable.
Low exposure rate in a high-exposure vertical. If Conductor's data puts your vertical, say healthcare, at 48.75% AIO trigger rate, and your own sample returns only 19%, you have either a sample-composition problem or an intent mismatch. Your tracked queries likely skew transactional, where AIOs are rare. Re-stratify to ensure informational queries represent their fair share of the sample.
Rising exposure rate over time. A 5-percentage-point increase over 60 days is, in this domain, substantial movement. It means Google is routing more of your keyword neighborhood through the AIO layer, compressing organic real estate below. This is, therefore, the clearest signal to redeploy content budget toward AIO-optimized formats and away from pure position chasing.
Stable exposure with declining citation. This pattern appears in roughly one in five domains during growth phases in our tracking data, and it signals a model-update disruption. Gemini 3 alone replaced approximately 42% of previously cited domains in one update, with more than half of new citations going to domains not previously included.
Full-set tracking versus stratified sampling: the real comparison
| Dimension | Full-set tracking (1,000+ queries) | Stratified sampling (150-200 queries) |
|---|---|---|
| Time to first estimate | 2-4 weeks (tool setup, crawl, normalization) | 1 afternoon |
| Monthly cost | $200-$600+ (SE Ranking, Keyword.com at scale) | $0-$50 (manual or small plan) |
| Accuracy for overall exposure rate | Near-exact | ±4 pp in 91% of checks (AEO Content internal) |
| Query-level specificity | Full: every keyword checked individually | None: sample only |
| Competitor citation data | Yes | No |
| Trend detection speed | Same as sampling | Same as full-set |
| Localization support | Yes (Keyword.com city/ZIP) | Limited; requires separate local sample |
| Suitable for proving concept internally | Poor (high upfront cost) | Excellent |
| Suitable for page-level content decisions | Yes | No |
| Suitable for portfolio-level trend monitoring | Yes | Yes |
How sampling compares to full-set tracking tools
Full-set tracking tools such as SE Ranking, Keyword.com, Rankability, and Ahrefs Brand Radar automate the query-by-query coverage that sampling approximates.
The choice is not, as practitioners sometimes assume, a quality-versus-cost tradeoff; it is a precision-versus-breadth tradeoff that depends on the question you actually need to answer.
| Question | Sampling sufficient? | Full-set tool needed? |
|---|---|---|
| What is my overall AIO exposure rate? | Yes (±4 pts) | No |
| Which specific pages are cited most often? | No | Yes |
| Is my exposure trending up or down? | Yes | No |
| Which competitor pages appear instead of mine? | No | Yes |
| Is a specific high-value keyword in AIO? | No | Yes |
| How does my exposure compare to my vertical benchmark? | Yes | No |
The case for full-set tools is strongest when you need query-level specificity: knowing that the term "project management software for small teams" triggers an AIO, and knowing which competitor page is cited in it, is information only granular tracking can supply. Rankability's 2026 roundup makes the point exactly: no pair of AI platforms shares more than 24.1% of cited pages, so multi-surface per-term coverage genuinely requires per-term data.
The case for sampling is strongest when you need trend data fast and cannot justify the tooling budget or implementation time. Sampling produces a working exposure metric in a single afternoon. The full-set tool is the upgrade you earn after proving the metric matters to your organization, not the one you buy on faith before anyone is watching the number.
"A 150-query stratified sample reproduces the full-set AIO exposure rate to within 4 percentage points in 91% of monthly checks. The directional reading is precise even when the absolute figure is approximate, and it is the directional reading that drives content investment." - Michael Kansky, Co-Founder, AEO Content
Vertical benchmarks as a sanity check on your estimate
Once you have your sample-derived exposure rate, the most useful immediate action is to compare it against a vertical benchmark.
The benchmark tells you whether your site's AIO presence is normal, lagging, or ahead of the sector, and therefore whether the problem, if there is one, is in your content or in market conditions beyond your control.
Conductor's 2026 vertical study, synthesized in JY Scauri's review of 34 AI search studies, provides the most reliable public benchmarks currently available:
| Vertical | AIO trigger rate | AI referral traffic |
|---|---|---|
| Healthcare | 48.75% | 0.63% (lowest) |
| Finance | 25.79% | Moderate |
| Technology | ~15% | 2.8% (highest) |
| Real estate | 4.48% | Low |
Two tensions in this data are worth naming directly. First, exposure and referral traffic are inversely correlated by vertical: healthcare's 48.75% AIO trigger rate coexists with only 0.63% AI referral traffic, the lowest of any vertical, because the AIO fully answers healthcare queries and suppresses the click. Technology's lower ~15% trigger rate produces the highest AI referral traffic at 2.8%, because technology AIOs prompt follow-up reading rather than satisfying curiosity entirely. Knowing your vertical resets expectations about what a given exposure rate will produce in downstream traffic, which is, I think, a critical correction to naive exposure-rate thinking.
Second, these benchmarks are directional, not permanent. AI Overview coverage nearly doubled in two months in early 2025 before settling near the current 16% market-wide figure, and the vertical distribution will continue to evolve as Google extends AIO to new query types.
Building a repeatable measurement cadence
A single AIO exposure estimate is useful. A series of them, taken at consistent intervals, transforms the metric from a curiosity into a management signal that justifies content budget decisions.
The right cadence. Monthly checks are the practical default for most teams. Weekly checks are justified when you are running active content experiments and need to detect whether a specific intervention, such as adding FAQ schema or front-loading answer passages, moved the exposure or citation rate. Quarterly checks are acceptable only if your vertical is stable, low-AIO-trigger, and you have no active content program. Do not check less frequently than quarterly; the six-month gap that once worked for position tracking is too slow for a surface where a single model update replaced 42% of cited domains in one cycle.
The measurement log. Keep a running record with these columns for each monthly check: check date, total queries checked (n), queries with AIO present (a), queries where your domain is cited (c), exposure rate (a/n), citation rate (c/a), and a sample-change note for any terms added, removed, or restratified since the prior check.
Sample stability. Do not rebuild your query sample from scratch each month. Keep 80% or more of the sample stable across checks to ensure trends are genuine and not artifacts of composition change. Add or remove terms only when your content strategy changes substantially: a new product launch, a URL restructure, or a new topic cluster entering your editorial calendar.
When to graduate to full-set tooling. When exposure holds above your vertical benchmark for two consecutive quarters, and your leadership team is ready to allocate real budget to AIO citation improvement, a full-set tracking tool pays for itself by supplying the query-level data that justifies page-level investment. Until then, the sample gets you most of the signal at a fraction of the cost.
What will matter most in the next 12 months
Three forces are, in my judgement, set to reshape how exposure estimation works over the period ahead, and teams that understand them now will not be caught adjusting later.
AIO vertical expansion will compress the sampling advantage. Google AI Overviews have expanded from 16% of queries (current market-wide average) toward higher trigger rates in more verticals. As real estate's current 4.48% rate climbs and finance's 25.79% climbs further, the 150-query sample will become standard practice rather than a workaround. The teams building the measurement habit now will have trend baselines; the teams that wait will be starting from zero.
Location-level granularity will become mandatory. Google's AIO localization is already creating divergent exposure rates for the same keyword depending on the user's city or ZIP code. The current workaround, Keyword.com's city-level verification, is sufficient today. Within 12 months, multi-location businesses will need location-stratified samples: one stratum per major market, rather than one national sample. The methodology remains the same; the sample size requirement per location roughly doubles.
Citation tracking and exposure tracking will converge in tooling. The current gap between exposure estimates (does an AIO appear?) and citation data (does our page appear in it?) requires two separate workflows. I expect the leading platforms to close this gap, offering integrated reports that show exposure rate alongside per-page citation frequency in one interface. When that tooling arrives, the stratified sample methodology described here will migrate from manual practice to the input layer of those platforms, not away from it. The sampling logic endures; the execution surface changes.
AEO FORECAST - 12-24 months OUTLOOK
Where AI Overview exposure heads by vertical
Three scored forecasts on how AI Overviews spread across verticals and reshape which sources get cited over the next two years.
What shifts in AI Overview exposure next
Use these to gauge how much AI Overview exposure your vertical faces before committing measurement effort.
Over the next 12-24 months AI Overview exposure will stay sharply uneven by sector: with overall query coverage settling near 16% (Semrush) and healthcare already triggering AI Overviews on about 48.75% of queries, sectors like healthcare and automotive will carry multiples of the average while low-trigger sectors see little, letting operators estimate exposure from a vertical benchmark.
Because AI systems fan one question out into many parallel sub-queries and platforms cite largely different sources, the market will move over 12-24 months toward estimating exposure from representative prompt samples across multiple AI surfaces rather than exhaustive per-keyword tracking, backed by well-funded platforms such as Profound ($96M Series C) and priced tiers from about $99 to $399 a month.
Rather than rewarding entrenched authority, AI answers will keep reshuffling their cited sources over the next 12-24 months: a single model update (Gemini 3) already replaced about 42% of cited domains, more than half of new citations went to previously uncited domains, and the overlap between top-10 organic results and AI-cited sources fell to roughly 38%, so freshly published and non-traditional sources will keep displacing established ones.
Emerging, Not Established AI Overview query coverage climbed from 6.49% to 13.14% between January and March 2025, then settled around 16% by the end of 2025, while ad displacement already hit 64.6% in healthcare and roughly 50% in automotive. No two AI platforms shared more than 24.1% of the pages they cited, and roughly half of AI citations came from recently published content. No two AI platforms overlapped on more than 24.1% of cited pages, and one tracked question can surface across dozens of related prompts once a model expands it.
Supporting and contrary sources
Both corroborating studies and dissenting signals sit behind each forecast below.
- What 34 Studies Reveal About AI Search in 2026 - Surfaced points the same way. [Substack / Newsletter]77 AI-search studies (published Jan 1-Mar 31, 2026) were scored against five weighted criteria; 34 passed, 43 were cut - mostly failing on transparency or sample quality, not size (JY Scauri / Surfaced analysis). “Maximum exposure, minimum clicks. AI tends to answer health queries completely without needing to send anyone anywhere.”
- Backing it: How are you tracking AI performance? My take on impressions in a. [Community / Forum]AI Overviews jumped from 6.49% to 13.14% of queries between January and March 2025 (roughly doubling in ~2 months), per the author's cited figure. “Impressions have long been a second-class metric in SEO. But in the AI era they are my key (current) leading indicator, in combination with AI citations.”
- Google AI Overviews are quietly destroying ad visibility (and is the strongest public backing for this call. [Community / Forum]Ads lose visibility to AI Overviews 25% of the time on average (per research cited in OP, sourced from Search Engine Land). “Less clicks = less inventory to bid on = advertisers bidding more for less (higher cpc). That's something I haven't seen google, or anyone really, come up with…”
- Backing it: Getting Started with AI Visibility by Keyword.com. [Video]The demo tracks the brand Mailchimp.com using a single general topic, "best email marketing platforms," from which keyword.com auto-generates suggested prompts (takes ~5-15 seconds). “The detection rate is how many times throughout all the runs was Mailchimp actually detected in the result. So, 100% of the time here.”
- Top 9 Tips To Master AI Overview Optimization in 2026 | Medium is the strongest public backing for this call. [Blog]Gemini 3 replaced about 42% of previously cited domains in a single update (author's claim). “The engine rewards the best answer, not the biggest name.”
What could flip these forecasts
Scenarios in query-coverage growth, citation churn, and vertical mix that would reverse the calls above.
The Hedge
Of everything here, 83 carries the strongest support, while 63 is the read most worth challenging.
- Buyers changing priorities, or regulators changing rules, hit Vertical concentration of exposure first.
- A source base that turns contrary would leave Citation churn beats incumbency as the forecast still standing.
Key Takeaways
Key takeaways
- A stratified sample of 150 to 200 queries reproduces the full-set Google AI Overview exposure rate to within ±4 percentage points in 91% of monthly checks (AEO Content internal dataset, n=175 median, MAD 3.1 pp).
- Stratify on three axes: topic cluster (GSC landing page grouping), query intent type (informational 50%, commercial 30%, transactional 20%), and search volume tier (high/medium/long-tail proportional to your overall query distribution).
- Execute the check within a 48-hour window. AIO presence fluctuates: approximately 17% of AIO-present queries in one weekly check are absent the next week.
- Tools for checking AIO presence: SE Ranking (AIO detection since January 2024), Keyword.com (city-and-ZIP verification), Google Search Console (free proxy via SERP feature impressions).
- Calculate: exposure rate = AIO-present / n × 100; citation rate = domain-cited / AIO-present × 100; 95% CI = ±1.96 × √(p × (1-p) / n) × 100.
- Compare against vertical benchmarks: healthcare 48.75%, finance 25.79%, technology ~15%, real estate 4.48% (Conductor, 2026).
- Keep 80% or more of the sample stable across monthly checks to ensure trends reflect reality and not sample composition changes.
- Graduate to full-set tooling when exposure holds above your vertical benchmark for two consecutive quarters and leadership is ready to allocate budget to page-level citation improvement.
The truth, arrived at after enough checks to be confident of it, is this: the teams that win at AI Overview visibility are not the ones with the biggest tracking budget, but the ones with the most consistent measurement discipline. A 175-query stratified sample, run monthly, will tell you whether your exposure is growing or shrinking, whether you are above or below your vertical benchmark, and whether a content intervention actually moved the needle. It will not tell you which specific keyword triggered an AIO this morning, and for that granular question you will, indeed, need a full-set tool. But for the strategic question, the one that determines where the next content dollar goes, the sample is not a compromise. It is the correct instrument for the job.
I have seen organizations stall for quarters waiting for the budget to justify a full tracking subscription, measuring nothing in the meantime. The stratified sample ends that stall. Run the first check this week. The number you get will not be perfect; it will be actionable, and actionable is what you actually need.
Once your stratified sample has given you a working exposure rate, the natural next step is understanding which of your pages are actually being cited within those AI Overviews and where competitors appear instead. AEO Content's Brand Mentions and Listings Tracking surfaces that citation-level data alongside your exposure estimate, connecting the "how often does AIO appear" question to the "why is it choosing someone else" answer.
Frequently asked questions
What is AI Overview exposure rate?
AI Overview exposure rate is the share of queries in a defined keyword set that trigger a Google AI Overview result. It is calculated as the number of queries with an AIO present divided by the total queries checked, expressed as a percentage. A site with a 24% exposure rate has AI Overviews appearing on roughly one in four queries in its tracked keyword universe. This is distinct from citation rate, which measures how often the site's own domain is cited as a source within those AIOs.
How many keywords do I need to track AI Overview exposure?
A stratified sample of 150 to 200 queries is sufficient for strategic exposure rate estimation. In AEO Content's internal dataset, samples in that range reproduce the full-set exposure rate to within ±4 percentage points in 91% of monthly checks, with a median absolute deviation of 3.1 percentage points at a sample size of 175. Below 150 queries, confidence intervals widen to the point where trend detection becomes unreliable. Above 300 queries, the accuracy gain is marginal and full-set tooling typically becomes more cost-efficient.
What is a good AI Overview exposure rate?
It depends on your vertical. Healthcare queries trigger AI Overviews at a rate of 48.75%, finance at 25.79%, technology at approximately 15%, and real estate at 4.48% (Conductor, 2026). The market-wide average is approximately 16% (Semrush, 2026). A "good" exposure rate is one that meets or exceeds your vertical benchmark; the absolute number matters less than how it compares to what AI Overview coverage looks like in your specific keyword neighborhood.
How often does Google AI Overview presence change?
AIO presence fluctuates substantially week to week. In AEO Content's internal tracking data, approximately 17% of queries that show an AI Overview in one weekly check do not show one the following week. This volatility is why the stratified-sample method requires executing the entire sample within a 48-hour window. A check spread over multiple weeks will mix AIO-present and AIO-absent states for the same queries, producing a corrupted and unreliable estimate.
Which tools can check whether a keyword shows an AI Overview?
Three tools serve the stratified-sample workflow reliably. SE Ranking has tracked AI Overview presence since January 2024 and is the most established option for bulk checks. Keyword.com provides city-and-ZIP-level geographic verification, which is important for local businesses and multi-market sites where Google localizes AIO results by location. Google Search Console provides a free proxy method: filtering impressions by the AI Overview SERP feature in the Performance report, though it does not give query-level binary presence data as cleanly as the dedicated tools.
Does blocking Googlebot or GPTBot affect AI Overview exposure?
Blocking GPTBot affects ChatGPT's training and browsing index but has no direct impact on Google AI Overviews, which are served by Google's own crawling infrastructure via Googlebot. Blocking Googlebot will reduce or eliminate your presence in AI Overviews because Google cannot index your pages. There is no evidence that blocking GPTBot reduces or increases AIO exposure. These are separate systems with separate crawlers and citation mechanisms.
Is AI Overview exposure the same as AI Overview citation?
No. Exposure rate measures whether an AI Overview appears for a query; citation rate measures whether your domain is cited as a source within that AI Overview. A site can have high exposure (AI Overviews appear frequently in its keyword set) and low citation (its pages are rarely chosen as sources). The two metrics diagnose different problems: high exposure with low citation points to a content structure problem, while low exposure in a high-exposure vertical points to an intent-mismatch problem in the sample or the site's content.
When should I upgrade from sampling to full-set AIO tracking?
Upgrade when you need query-level specificity: knowing which specific pages are cited, which competitor pages appear instead of yours, or whether a particular high-value keyword triggers an AIO. The stratified sample answers the strategic question of overall exposure trend; it cannot answer page-level questions. A practical upgrade threshold: when your sampled exposure rate has held above your vertical benchmark for two consecutive quarters and your organization is ready to allocate budget to page-level content optimization.
Sources & Further Reading
References
- Semrush. (2026). AI Overviews: Presence rate across U.S. queries, market-wide baseline. Semrush Research.
- Conductor. (2026). AI Overview trigger rates by vertical: healthcare, finance, technology, real estate. Conductor Research.
- Scauri, J. Y. (2026). 34 AI search studies synthesized: visibility, citation, and traffic patterns. Search Engine Journal.
- Rankability. (2026). AI Overview platform citation overlap: cross-platform cited-page analysis. Rankability Research.
- SE Ranking. (2024). AI Overview detection methodology: how SE Ranking tracks Google AIO presence per query. SE Ranking Help Center.
- Keyword.com. (2025). Local SERP verification: city and ZIP-level AIO presence tracking. Keyword.com Documentation.
- Google. (2025). Search Console SERP features: AI Overview impression data in the Performance report. Google Search Central Documentation.
- Ahrefs. (2025). Brand Radar: tracking brand mentions and citations in AI-generated search results. Ahrefs Product Documentation.
- AEO Content. (2024-2026). Internal AIO tracking dataset: sample-size accuracy, weekly churn rate, and model-update citation displacement. AEO Content proprietary research.
Written by
Michael Kansky
Co-Founder, AEO Content
Michael Kansky is a serial founder and operator and co-founder of AEO Content, where he shapes product and go-to-market strategy for an AI-search content optimization platform.
Connect on LinkedInRelated Articles
Summarize This Article With AI
Open this article in your preferred AI engine for an instant summary.